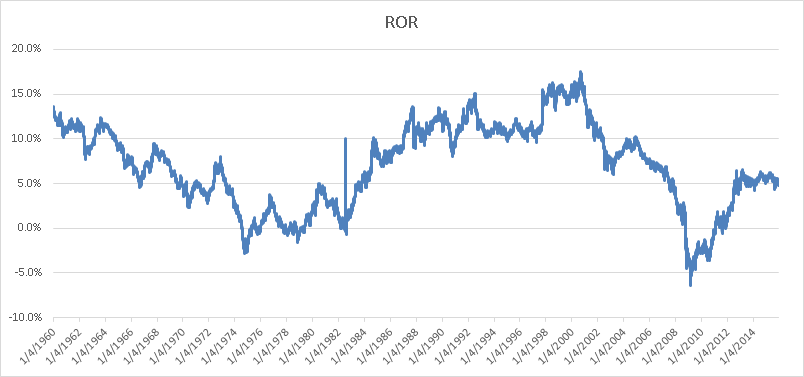
I use what is below to calculate a total rate of return over a period of time. This is most useful when computing compounded returns for an individual stock, or an index such as the S&P 500…
Public Function ror(pv As Currency, fv As Currency, p As Double) As Double
  Dim l As Double
  Dim i As Double
  i = 0.1
  l = pv
  Do While l < fv
    l = pv * ((1 + i) ^ p)
    i = i + 0.00001
  Loop
  Do While l > fv
    l = pv * ((1 + i) ^ p)
    i = i - 0.00001
  Loop
  ror = i
End Function
You can then download historical prices, such as the following to get historical closing prices for the S&P 500…
http://real-chart.finance.yahoo.com/table.csv?s=%5EGSPC&d=11&e=29&f=2015&g=d&a=0&b=3&c=1950&ignore=.csv
If you setup the following in a given cell for the formula, it will produce the average growth rate for the time period requested. For example, this will produce the rate for the last ten years when the closing prices are sorted in closing date order…
=ror(B4,B2515,10)
…with the output below…
You can also use what is below as a simple cell formula to get the same rate of return…
=(B2515/B4)^(1/10)-1